1. Home
  2. Features
  3. Dialing reports

Dialing reports

The dialing funnel, by day, agent and list

The reporting screen builds the funnel from your own call records: dials and connects per day, per agent with pace per hour, and per list. Contact rate and appointment-set rate are computed from outcomes, and connected means a human answer or a connected call, defined openly. You read your own numbers instead of a vendor's benchmark.

Real product interface. Sample data, fictional people and numbers.

How it works.

4 steps, in the order they happen during a session.

  1. 1

    The funnel, defined

    Dials count attempts; connected counts calls with a human answer or a connected status; contact and appointment rates divide accordingly. The definitions ship with the numbers.

  2. 2

    Per agent, with pace

    Each agent row shows dials, connects and dials per hour in the window, so you compare pace across operators on the same definitions, not on claims.

  3. 3

    Per list, honestly

    List rows show dials and connects for each list in the window, which is how you learn which source connects and which burns minutes without answers.

  4. 4

    Chosen window

    Stats cover a selectable day window, and the team funnel is an admin view. Agents see their own activity; the owner sees the whole team.

The specifics.

What the product does today. Included on every plan, from Solo at $49 per seat.

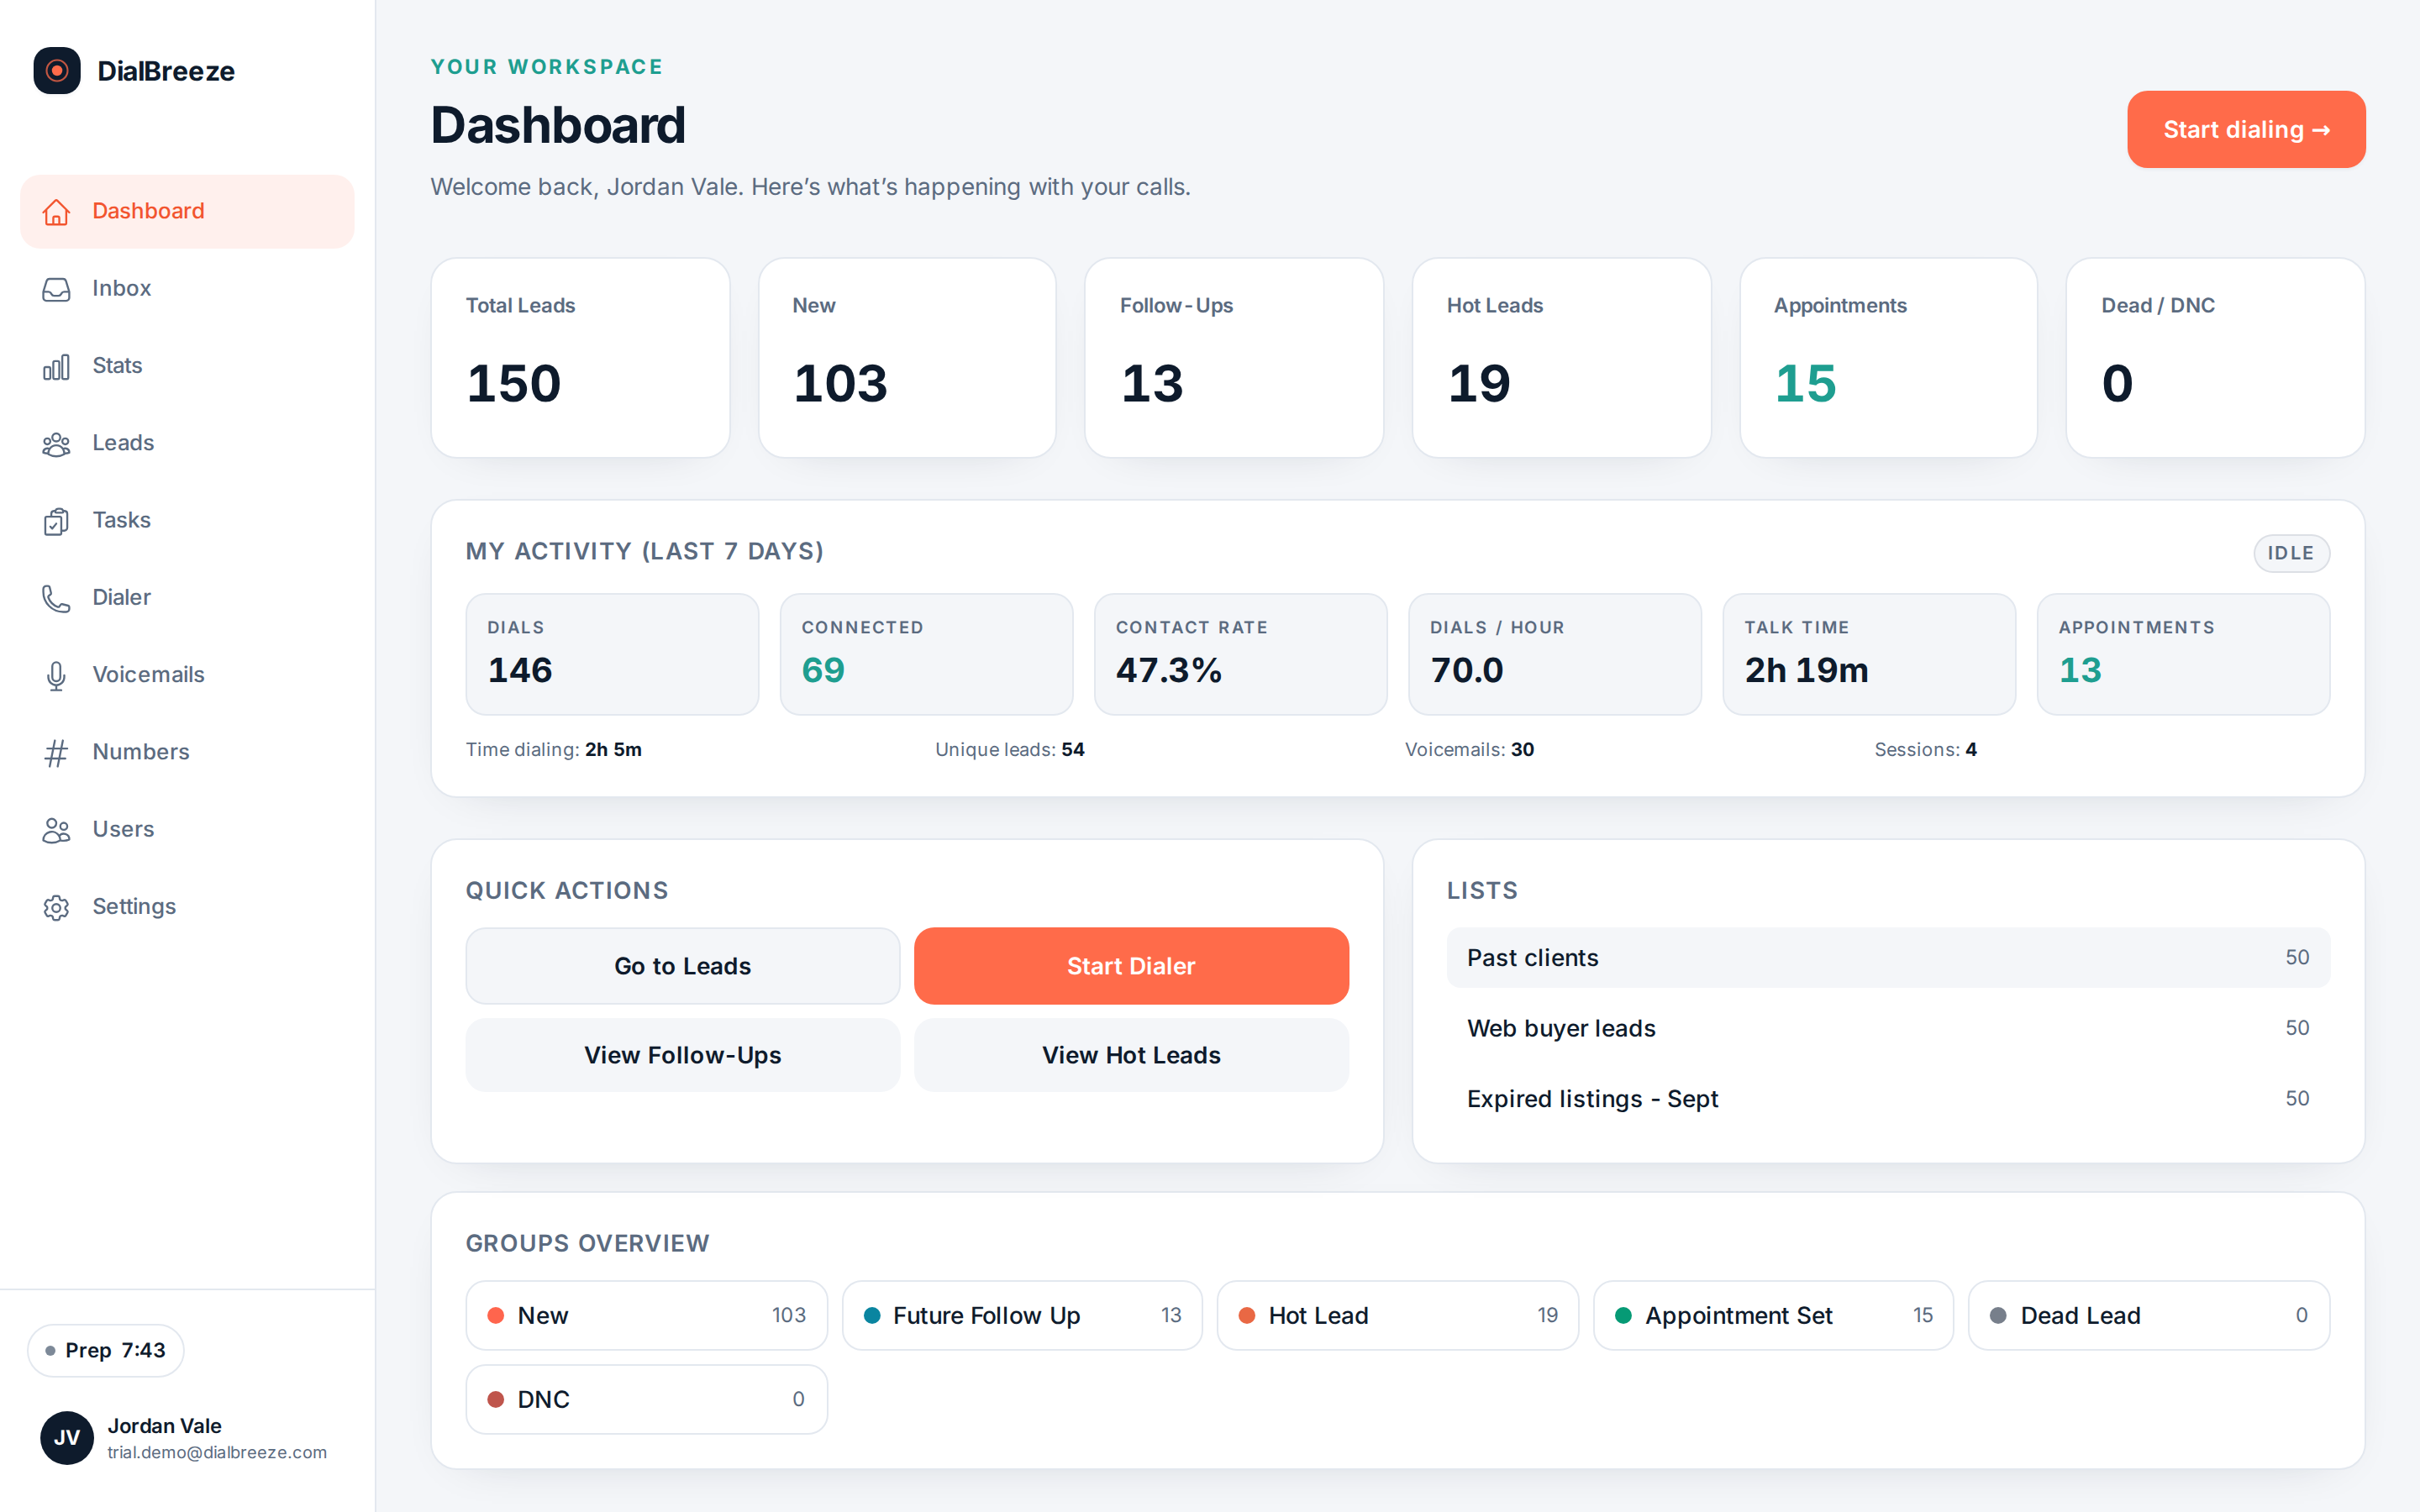
Workspace dashboard with dialing metrics and recent activity across the team
Real product interface, sample data.
Funnel metrics
Dials, connected, contact rate and appointment-set rate over the window.
Connected means
A connected call status or a machine-detection result of human.
Agent rows
Dials, connects and dials per hour per agent in the chosen window.
List rows
Dials and connects per list, so source quality is measurable.
Admin scope
The team funnel is admin-only; agents see their own activity.
Own records
Every figure is computed from your call table, not sampled or estimated.

Definitions you can check

A report is only as good as its definitions, so these ship in the open. Dials count attempts placed in the window. Connected counts calls with a connected status or an answering-machine result of human. Contact rate divides connected by dials. Appointment-set rate divides appointments by connected, because the appointment is the outcome that pays.

The same definitions apply across the day chart, the agent table and the list table, so a number means the same thing everywhere you meet it. Voicemail, interested and DNC dispositions are identifiable from outcome labels, which is how outcome mix can be reviewed alongside volume.

Everything is computed from your call records. Nothing is sampled, modeled or borrowed from a vendor benchmark, and nothing in the report claims your numbers should match anyone else's.
Using the funnel

Per-day dials and connects show the shape of the operation: ramp, lunch dip, end-of-day fade. The agent table adds dials per hour, an honest pace metric on shared definitions, useful for spotting both a struggling operator and an unusual day worth a second look.

The list table is where money decisions live. Two lists with equal dial counts and different connect rates are two different purchases, and the funnel shows that split over any window you choose. Pair it with the per-lead skip reasons from the session records to see whether a weak list is a data problem or a timing problem.

For context only: production use measured a median of about 85 dials per active hour and a 17.8 percent person-connect rate over 90 days. Those are measurements, not promises, and the report exists so you can establish your own.

Questions about dialing reports.

Straight answers. Anything else: email support.

What counts as a connected call?
A call with a connected status, or one whose answering-machine detection returned human. That definition is fixed across the day chart, the agent table and the list table, so rates mean the same thing everywhere. It is honest about its edge: a machine misread as human counts as connected, which is one reason connect rate is read alongside dispositions.
Can I see which list performs best?
Yes. The list table shows dials and connects for each list over the window you choose, which makes source quality measurable instead of anecdotal. A list that dials heavily but rarely connects shows up plainly. Read it next to session skip reasons to tell a data problem from a timing problem.
Who can see team-wide numbers?
The team funnel is an admin view. Agents see their own activity, and admins see totals, per-agent and per-list breakdowns. If you want broader visibility, export decisions stay with your admin. This keeps operator pace comparisons, which can be loaded, in the owner's hands rather than on every screen.
Does DialBreeze tell me if my numbers are good?
No. The report shows what happened in your records with open definitions. For reference, production use measured about 85 dials per active hour at median and a 17.8 percent person-connect over 90 days, but those are measurements from one operation, not promises or targets. Establish your own baseline, then judge changes against it.
Can I export reporting data?
The funnel itself is a live view in the app. What you can export today: the lead table as admin CSV, and call dispositions to your CRM through the signed webhook, from which your analysts can build any report. If you need raw call data in a specific shape, raise it in onboarding so the answer is written down before you commit.

Try it on a real session.

Your 14-day trial runs on a Telnyx sandbox with test numbers; nothing reaches a real person. A human provisions the environment. The 14 days start when it is ready and we email you. No credit card is required. On conversion, you connect your own Telnyx account and real calling lists.

Start a 14-day trialPricing